On this page
- Per-country resource footprints data
- International embodied flows data
- Spatially explicit footprints
- Key papers on resource footprinting
Resource Footprints
Resource footprints refers to the environmental footprint associated with consumption in a given country. Using the Leontief model with an MRIO database, footprints can be calculated for a variety of resources and environmental stressors, e.g. CO2 emissions, water use, air pollution emissions, land use. Consumption-based accounts (CBA), "embodied", or "embedded" flows, and "virtual (water/phosphorus/etc)" are synonyms for resource footprints. We maintain a separate dedicated page for carbon footprints.
This report provides precalculated resource footprints for all of the environmental stressors included in Eora. Eora includes environmental accounts for most GHGs, air emissions, water use, land use, P and N use, and more. For the full list of included indicators refer to the file here file.
These reports includes the following information for each stressor in each country and each year:
- domestic resource use / territorial emissions (this includes both industrial and household emissions)
- resources embodied in imports
- resources embodied in exports
- net footprint / consumption-based account
Download here for year 2023:
To get data for other years, construct the a URL as follows with the desired years:
https://worldmrio.com/ComputationsM/Phase199/Loop082/leontief/tradereport_2017.txt
Or alternatively download this single .mat file, with data + metadata:
Bilateral Trade Data
This file reports embodied flows of resources between producers and final consumers aggregated to the country level. Note that these bilateral flows are inclusive of indirect flows; the flow from producer country A to Consumer C actually means C's total Footprint within A. The flow does not not mean the direct trade of goods, or even the embodied resources within that direct trade of goods, but actually means B's total footprint in A, even inclusive of goods that C may have imported from another country B but which were originally produced in A. The above tradereport_[year].txt files are merely a collapsed version of this tensor. The tensor has the dimensions N resource flows × 190 origin countries × 190 consumer countries. The flow from A to A is A's domestic usage of domestic resources. The sum of its exports to all other countries are the exports, the sum of imports from all others are imports, and the Footprint is then territorial usage plus imports minus exports. Note there are some small negative values in this dataset; these can be ignored or set to 0.
The data are provided as a .mat file, which is readable by MATLAB, Octave (an open-source version of MATLAB), Python, and R. The file contains data and metadata. Download here:
Spatially explicit footprints
Spatial footprinting seeks to connect earth observation data - spatially explicit layers showing where impacts or production activities are occuring - to a global supply chain database. Thus it is possible to link consumers (individuals, companies, or countries) to the upstream hotspots of their purchases. This is useful for reducing the whole-life-cycle environmental footprint and for evaluating upstream supply chain risk.
The current generation of spatial footprint is not perfect. No global dataset (yet) exists itemizing the global supply chains in to/out of individual pixels, so the method involves estimation. But the method is designed to be error-tolerant and overestimate the true extent of production hotspots.
There are three intial papers presenting the spatial footprint concept with Eora:
Kanemoto, K., D. Moran, Hertwitch, E. (2016) Mapping the Carbon Footprint of Nations. Environmental Science and Technology 10.1021/acs.est.6b03227
This paper was highlighted as an Editor’s Choice in Science
D. Moran, Kanemoto, K. (2017) Identifying the Species Threat Hotspots from Global Supply Chains. Nature Ecology & Evolution. 10.1038/s41559-016-0023
D. Moran, Kanemoto, K.. (2016) Tracing Global Supply Chains to Air Pollution Hotspots. Environmental Research Letters 10.1088/1748-9326/11/9/094017
This work is being continued through the Footprints 2.0 project.
Biodiversity Footprints
Biodiversity footprints link species threats, taken from the IUCN Red List, to production activities and then onward to the final consumers whos demand induces that production. It provides one method for attributing species threats to companies and consumers.
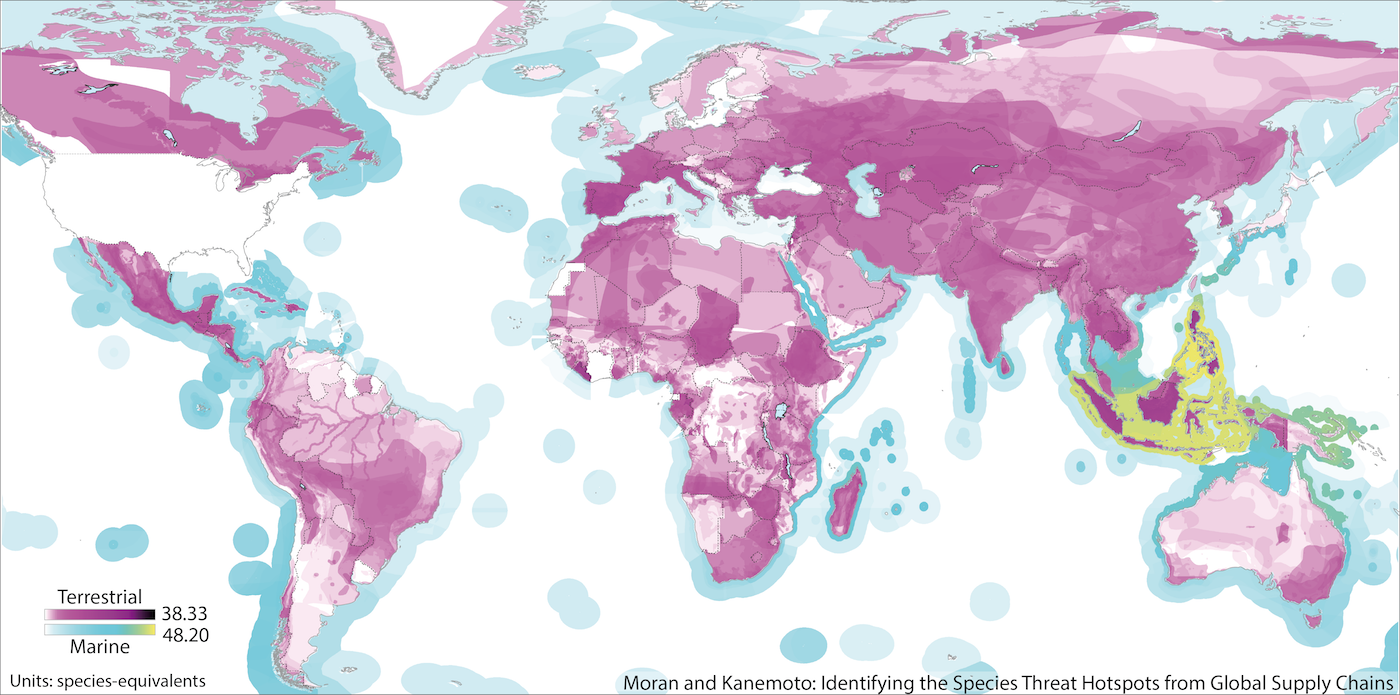
Figure: Global hotspots of species threat linked to consumption in the United States. Darker areas indicate areas of threat hotspots driven by US consumption, based on the mix of threats exerted in each country and the mix of export goods sent to the United States for final consumption.
Lenzen, M, D. Moran, K. Kanemoto, B. Foran, L. Lobefaro, A. Geschke. (2012) International trade drives biodiversity threats in developing nations. Nature 10.1038/nature11145
D. Moran, Kanemoto, K.. (2017) Identifying the Species Threat Hotspots from Global Supply Chains. Nature Ecology & Evolution. 10.1038/s41559-016-0023
These papers were both widely covered in the press, including by Scientific American, BBC, Reuters, AFP, Le Monde, and many national magazines and newspapers. Edgar Hertwich wrote a nice commentary about the original paper.
We also have a paper validating the results from the MRIO-based study for several selected sector+location case studies:
D. Moran, Petersone, M., Verones, F. On the Suitability of Input-Output Analysis for Calculating Product-Specific Biodiversity Footprints. Ecological Indicators 10.1016/j.ecolind.2015.06.015
In another paper, the LC-IMPACT life-cycle impact assessment framework is applied to the EXIOBASE MRIO to calculate biodiversity footprints:
Verones, F., D. Moran, Stadler, K., Wood, R. Kanemoto, K. (2017) Resource footprints and their Ecosystem Consequences. Scientific Reports 10.1038/s41559-016-0023
The Belmont Forum TSUNAGARI project explored the use of global supply chain accounting to link local biodiversity impacts to remote consumers.
Nakaoka, M., and 16 co-authors (2017) TSUNAGARI: a new interdisciplinary and transdisciplinary study toward conservation and sustainable use of biodiversity and ecosystem services. Ecological Research. 10.1007/s11284-017-1534-4
Related papers
Materials and critical materials:
Wiedmann, T., H. Schandel, D. Moran, J. West, M. Lenzen, K. Kanemoto, S. Suh. The Material Footprint of Nations – Reassessing Resource Productivity. Proceedings of the National Academy of Sciences doi:10.1073/pnas.1220362110
Wiedmann, T., Schandl, H., D. Moran. The footprint of using metals – new metrics of consumption and productivity. Environmental Economics and Policy Studies 10.1007/s10018-014-0085-y
D. Moran, D. McBain, K. Kanemoto, M. Lenzen, A. Geschke Global Supply Chains of Coltan. Journal of Industrial Ecology 10.1111/jiec.12206
Labour and wage (in)equality:
Alsamawi, A., Murray, J., Lenzen, M., D. Moran, Kanemoto, K.. (2014) The Inequality Footprint of Nations: A Novel Approach to Quantitative Accounting of Income Inequality. PLOS One 10.1371/journal.pone.0110881
Water dependencies:
Lenzen, M, D. Moran, Bhaduri, A., Kanemoto, K., Bekchanov, M., Geschke, A., Foran, B. (2013) International Trade of Scarce Water. Ecological Economics 10.1016/j.ecolecon.2013.06.018
Nitrogen and air pollution footprints:
D. Moran, Kanemoto, K.. (2016) Tracing Global Supply Chains to Air Pollution Hotspots. Environmental Research Letters 10.1088/1748-9326/11/9/094017
Oita, A., Malik, A., Kanemoto, K., Geschke, A., Nishijima, A., Lenzen, M.(2016). Substantial nitrogen pollution embedded in international trade. Nature Geoscience, 9(2), 111–115. 10.1038/ngeo2635
Theory of ecologically unequal exchange:
Moran, D., Lenzen, M., Kanemoto, K., Geschke. A. (2013) Does ecologically unequal exchange occur? Ecological Economics, 89, pp.177-186 10.1016/j.ecolecon.2013.02.013
This paper prompted a critical response by Dorninger and Hornborg; here is their commentary, and our reply