Carbon Footprint of Nations
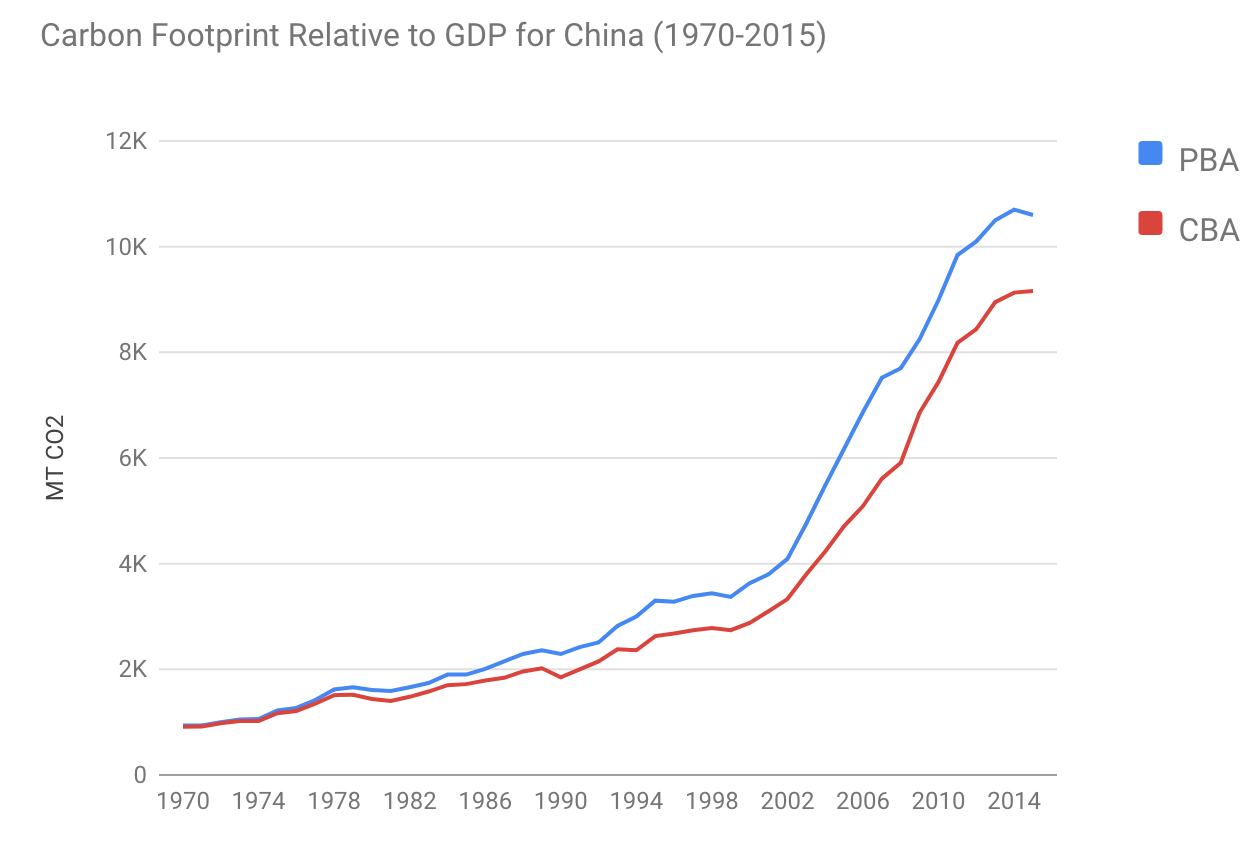
Consumption-based accounting (CBA) of emissions (also called carbon footprints) accounts for emissions associated with imported and exported goods. CBA reports the total emissions associated with final demand in each country.
Emissions physically occurring in a country are its territorial emissions. This is sometimes called production-based accounting (PBA). This is the standard reporting of GHG emissions as reported by CDIAC, IEA, the JRC EDGAR database, UNFCCC, and others.
CBA can be calculated using a global multi-region input-output (MRIO) model which traces global supply chains. This dataset uses the Eora MRIO model to calculate the CBA emissions for each country.
Emissions from fossil fuel combustion and cement production are reattributed to the countries where final demand induced the production associated with those emissions. Emissions from aviation and marine bunker fuels are not included in the CBA inventory, as no method has yet been developed to allocate emissions from bunker fuels to countries other than where the fuel is bunkered.
In this dataset, territorial emissions are taken from the PRIMAP emissions database, HISTCR scenario. Values are GgCO2eq KYOTO GHGs, excluding LULUFC. GDP data are from the World Bank. Population estimates are from the UN Population division (using the Medium Estimate projection). CBA results are from the Eora MRIO model (http://worldmrio.com) v199.82, years 1990-2018, by Daniel Moran, Keiichiro Kanemoto, and Arne Geschke.
Last updated: October 31, 2021
Downloads:
While the above file shows the summary of a country's total footrint, the following files detail the countries (and sectors) in which that footprint originates. These files report flows of embodied CO2 from each origin/emitter country to each destination/consumer country. The first two files are are text-delimited files that can be opened as pivot tables in Excel. (Note that flows from country X to country X are domestic flows, i.e. emissions occuring in X that are allocated to final consumers in X.) The third and fourth files show the country and sector of origin of footprints in Full and Eora26 detail for 2017. Units are Gg CO2 (1 Gg = 1Kt). If you encounter any issues reading these data files please refer to the FAQ.
The following files document footprints embodied in trade at the sector level. The columns report total embodied GHG footprint due to consumption in each country, and the rows itemize the country-sector in which those embodied emissions were originally emitted. Please note that some of these results are available only with paid licenses and if a file is shown in grey it is not available with your current access.
Sectoral-level embodied GHG in trade results »
bilateraltrade_2022_sectorwise_co2.txt bilateraltrade_2022_sectorwiseEora26_co2.txt
bilateraltrade_2021_sectorwise_co2.txt bilateraltrade_2021_sectorwiseEora26_co2.txt
bilateraltrade_2020_sectorwise_co2.txt bilateraltrade_2020_sectorwiseEora26_co2.txt
bilateraltrade_2019_sectorwise_co2.txt bilateraltrade_2019_sectorwiseEora26_co2.txt
bilateraltrade_2018_sectorwise_co2.txt bilateraltrade_2018_sectorwiseEora26_co2.txt
bilateraltrade_2017_sectorwise_co2.txt bilateraltrade_2017_sectorwiseEora26_co2.txt
bilateraltrade_2016_sectorwise_co2.txt bilateraltrade_2016_sectorwiseEora26_co2.txt
bilateraltrade_2015_sectorwise_co2.txt bilateraltrade_2015_sectorwiseEora26_co2.txt
bilateraltrade_2014_sectorwise_co2.txt bilateraltrade_2014_sectorwiseEora26_co2.txt
bilateraltrade_2013_sectorwise_co2.txt bilateraltrade_2013_sectorwiseEora26_co2.txt
bilateraltrade_2012_sectorwise_co2.txt bilateraltrade_2012_sectorwiseEora26_co2.txt
bilateraltrade_2011_sectorwise_co2.txt bilateraltrade_2011_sectorwiseEora26_co2.txt
bilateraltrade_2010_sectorwise_co2.txt bilateraltrade_2010_sectorwiseEora26_co2.txt
bilateraltrade_2009_sectorwise_co2.txt bilateraltrade_2009_sectorwiseEora26_co2.txt
bilateraltrade_2008_sectorwise_co2.txt bilateraltrade_2008_sectorwiseEora26_co2.txt
bilateraltrade_2007_sectorwise_co2.txt bilateraltrade_2007_sectorwiseEora26_co2.txt
bilateraltrade_2006_sectorwise_co2.txt bilateraltrade_2006_sectorwiseEora26_co2.txt
bilateraltrade_2005_sectorwise_co2.txt bilateraltrade_2005_sectorwiseEora26_co2.txt
bilateraltrade_2004_sectorwise_co2.txt bilateraltrade_2004_sectorwiseEora26_co2.txt
bilateraltrade_2003_sectorwise_co2.txt bilateraltrade_2003_sectorwiseEora26_co2.txt
bilateraltrade_2002_sectorwise_co2.txt bilateraltrade_2002_sectorwiseEora26_co2.txt
bilateraltrade_2001_sectorwise_co2.txt bilateraltrade_2001_sectorwiseEora26_co2.txt
bilateraltrade_2000_sectorwise_co2.txt bilateraltrade_2000_sectorwiseEora26_co2.txt
bilateraltrade_1999_sectorwise_co2.txt bilateraltrade_1999_sectorwiseEora26_co2.txt
bilateraltrade_1998_sectorwise_co2.txt bilateraltrade_1998_sectorwiseEora26_co2.txt
bilateraltrade_1997_sectorwise_co2.txt bilateraltrade_1997_sectorwiseEora26_co2.txt
bilateraltrade_1996_sectorwise_co2.txt bilateraltrade_1996_sectorwiseEora26_co2.txt
bilateraltrade_1995_sectorwise_co2.txt bilateraltrade_1995_sectorwiseEora26_co2.txt
bilateraltrade_1994_sectorwise_co2.txt bilateraltrade_1994_sectorwiseEora26_co2.txt
bilateraltrade_1993_sectorwise_co2.txt bilateraltrade_1993_sectorwiseEora26_co2.txt
bilateraltrade_1992_sectorwise_co2.txt bilateraltrade_1992_sectorwiseEora26_co2.txt
bilateraltrade_1991_sectorwise_co2.txt bilateraltrade_1991_sectorwiseEora26_co2.txt
bilateraltrade_1990_sectorwise_co2.txt bilateraltrade_1990_sectorwiseEora26_co2.txt
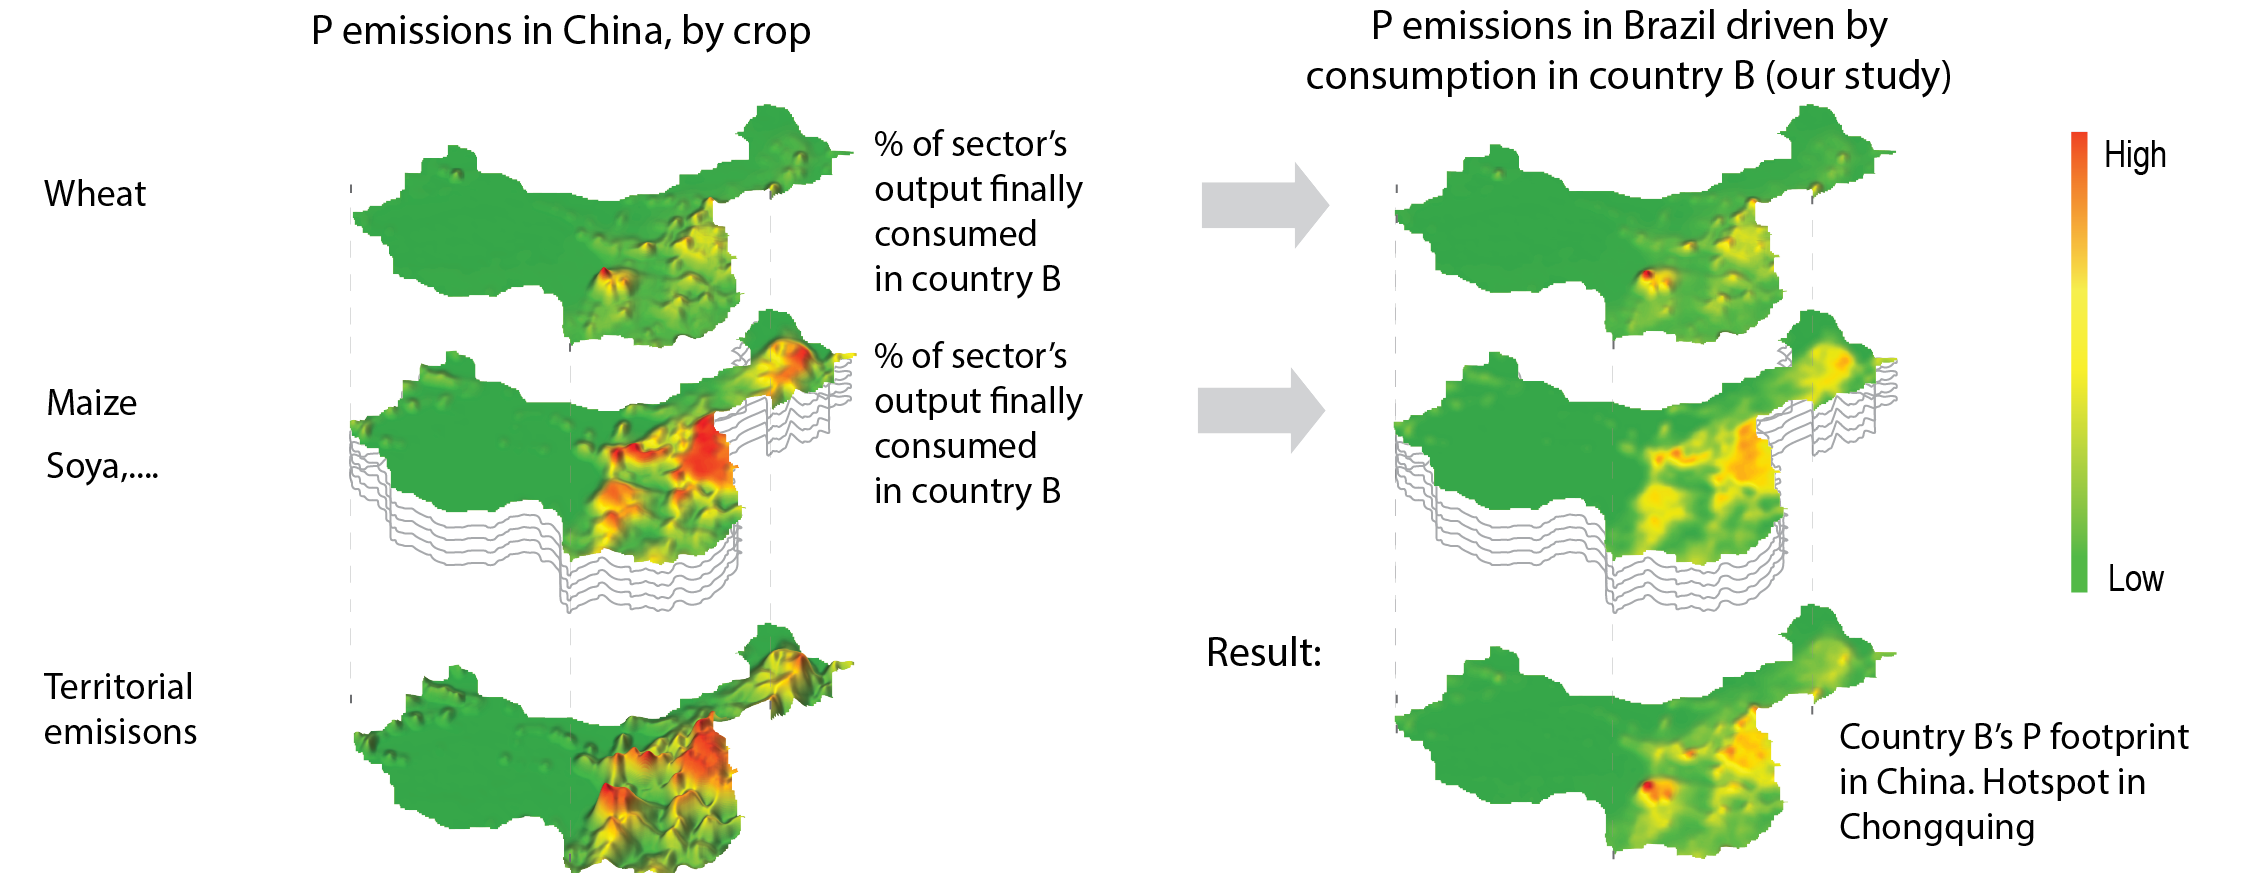
Spatially explicit carbon footprints
We have linked the Eora global supply chain database to the EDGAR spatially explicit GHG emissions dataset, allowing us to better resolve within each origin country where GHG emissions are occuring upstream, for a given demand bundle.
Kanemoto, K., D. Moran, Hertwitch, E. (2016) Mapping the Carbon Footprint of Nations. Environmental Science and Technology 10.1021/acs.est.6b03227
This paper was highlighted as an Editor’s Choice in Science
MRIO model intercomparison
Several MRIO models exist. There is variation in the CBA results across models, but this variation is generally considered acceptable. For more on intercomparison see:
D. Moran, Wood, R. (2014) Convergence between the Eora, WIOD, EXIOBASE, and OpenEU's consumption-based carbon accounts. Economic Systems Research. DOI:10.1080/09535314.2014.935298
Or visit our intercomparison results page
Another intercomparison website is the Environmental Footprints Explorer .
Selected carbon footprint papers
-
Kander, A., Jiborn, M., D. Moran, Wiedmann, T. National Greenhouse Gas Accounting for Effective Climate Policy on International Trade. Nature Climate Change 10.1038/NCLIMATE2555
Identifies, and proposes a solution (technology-adjusted consumption-based accounting) for, a conceptual shortcoming of consumption-bsaed accounting by which individual countries could potentially game the system by taking actions that improve their carbon footprint more than their actual contribution to reducing global GHG emissions.
-
Kanemoto, K., M. Lenzen, G. Peters, D. Moran, A. Geschke. Frameworks for comparing emissions associated with production, consumption, and international trade. Environmental Science & Technology 10.1021/es202239t
A comprehensive presentation of carbon footprint accounting (CBA) and the related Bilateral Embodied Emissions in Trade (BEET) concept, which measures embodied only bilateral trade, not further upstream - useful since most trade policy is set at bilateral trade borders, irrespective of additiaonl upstream or downstream countries.
-
Jiborn, M., Kander, A., Kulionis, V., Nielsen, H., Moran, D. Decoupling or delusion? Measuring emissions displacement in foreign trade. Global Environmental Change 10.1016/j.gloenvcha.2017.12.006
Extends the TCBA concept to measure displacement in trade.
-
Kanemoto, K. D. Moran, M. Lenzen, A. Geschke. International Trade Undermines National Emissions Targets: New Evidence from Air Pollution. Global Environmental Change 10.1016/j.gloenvcha.2013.09.008
Shows that shifting production and growing supply chains has mean that despite successful legislation in major economies, air pollution has grown globally. GHG emissions are following a similar trend.